sysstat is a great set of tools that you can use to collect statistics for I/O, CPU, memory, network and processes for troubleshooting and monitoring purposes.
Here's summary of the tools.
- iostat reports CPU statistics and input/output statistics for block devices and partitions.
- mpstat reports individual or combined processor related statistics.
- pidstat reports statistics for Linux tasks (processes) : I/O, CPU, memory, etc.
- tapestat reports statistics for tape drives connected to the system.
- cifsiostat reports CIFS statistics.
Sysstat also contains tools you can schedule via cron or systemd to collect and historize performance and activity data:
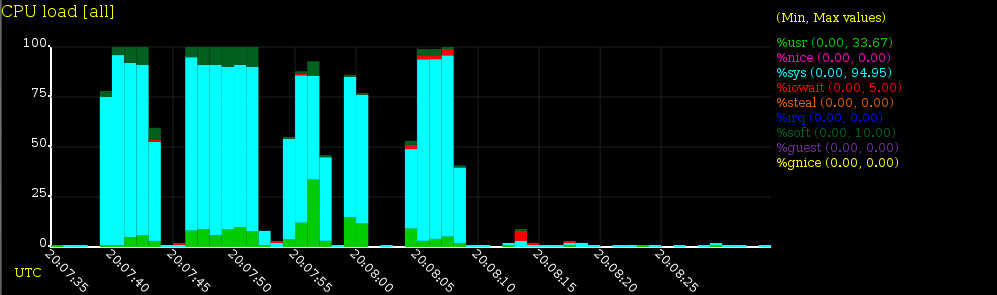
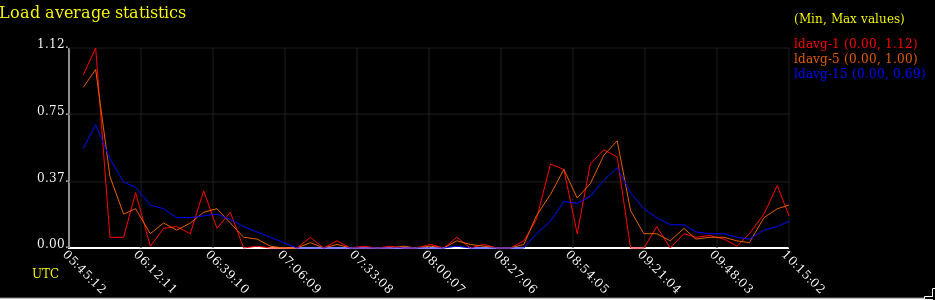
- sar collects, reports and saves system activity information (see below a list of metrics collected by sar).
- sadc is the system activity data collector, used as a backend for sar.
- sa1 collects and stores binary data in the system activity daily data file. It is a front end to sadc designed to be run from cron or systemd.
- sa2 writes a summarized daily activity report. It is a front end to sar designed to be run from cron or systemd.
- sadf displays data collected by sar in multiple formats (CSV, XML, JSON, etc.) and can be used for data exchange with other programs. This command can also be used to draw graphs for the various activities collected by sar using SVG (Scalable Vector Graphics) format.